plotpc
Plot classification line on perceptron vector plot
Syntax
plotpc(W,B)

plotpc(W,B,H)
Description
plotpc(W,B) takes these inputs,
W |
|
B |
|
and returns a handle to a plotted classification line.
plotpc(W,B,H) takes an additional input,
H | Handle to last plotted line |
and deletes the last line before plotting the new one.
This function does not change the current axis and is intended to be called after
plotpv.
Examples
Plot Classification Line
The code below defines and plots the inputs and targets for a perceptron:
p = [0 0 1 1; 0 1 0 1];
t = [0 0 0 1];
plotpv(p,t)
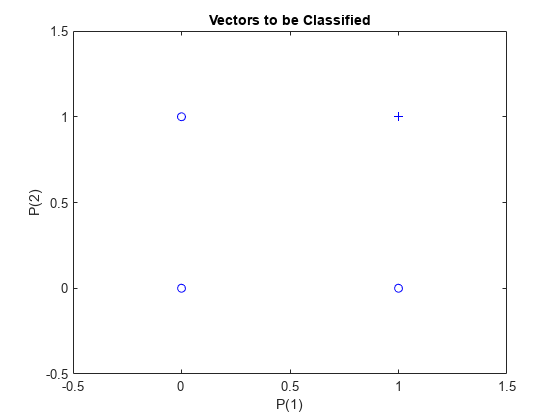
The following code creates a perceptron, assigns values to its weights and biases, and plots the resulting classification line.
net = perceptron;
net = configure(net,p,t);
net.iw{1,1} = [-1.2 -0.5];
net.b{1} = 1;
plotpc(net.iw{1,1},net.b{1})
Version History
Introduced before R2006a
See Also
You can also select a web site from the following list:
Americas
- América Latina (Español)
- Canada (English)
- United States (English)
Europe
- Belgium (English)
- Denmark (English)
- Deutschland (Deutsch)
- España (Español)
- Finland (English)
- France (Français)
- Ireland (English)
- Italia (Italiano)
- Luxembourg (English)
- Netherlands (English)
- Norway (English)
- Österreich (Deutsch)
- Portugal (English)
- Sweden (English)
- Switzerland
- United Kingdom (English)