plotsomtop
Plot self-organizing map topology
Syntax
plotsomtop(net)
Description
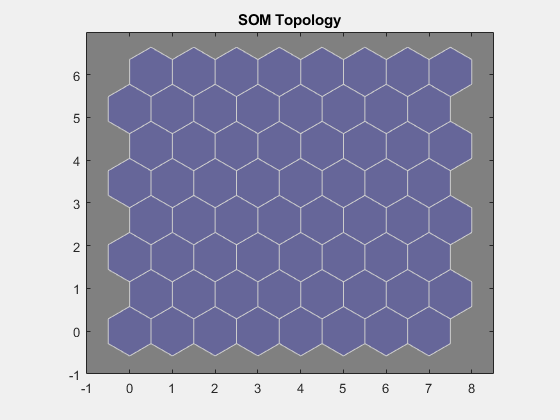
plotsomtop(net) plots the topology of a SOM
layer.
This plot supports SOM networks with hextop and
gridtop topologies, but not tritop or
randtop.
Examples
Plot SOM Topology
x = iris_dataset;
net = selforgmap([8 8]);
plotsomtop(net)
Version History
Introduced in R2008a
See Also
You can also select a web site from the following list:
Americas
- América Latina (Español)
- Canada (English)
- United States (English)
Europe
- Belgium (English)
- Denmark (English)
- Deutschland (Deutsch)
- España (Español)
- Finland (English)
- France (Français)
- Ireland (English)
- Italia (Italiano)
- Luxembourg (English)
- Netherlands (English)
- Norway (English)
- Österreich (Deutsch)
- Portugal (English)
- Sweden (English)
- Switzerland
- United Kingdom (English)